The latest results from the Cultural Enterprises Commercial Performance Barometer are now in, and here are the headlines:
- A mixed summer, with August admissions level with 2024 and July down
- Year-to-date admissions only slightly down on 2024 despite the difficult conditions
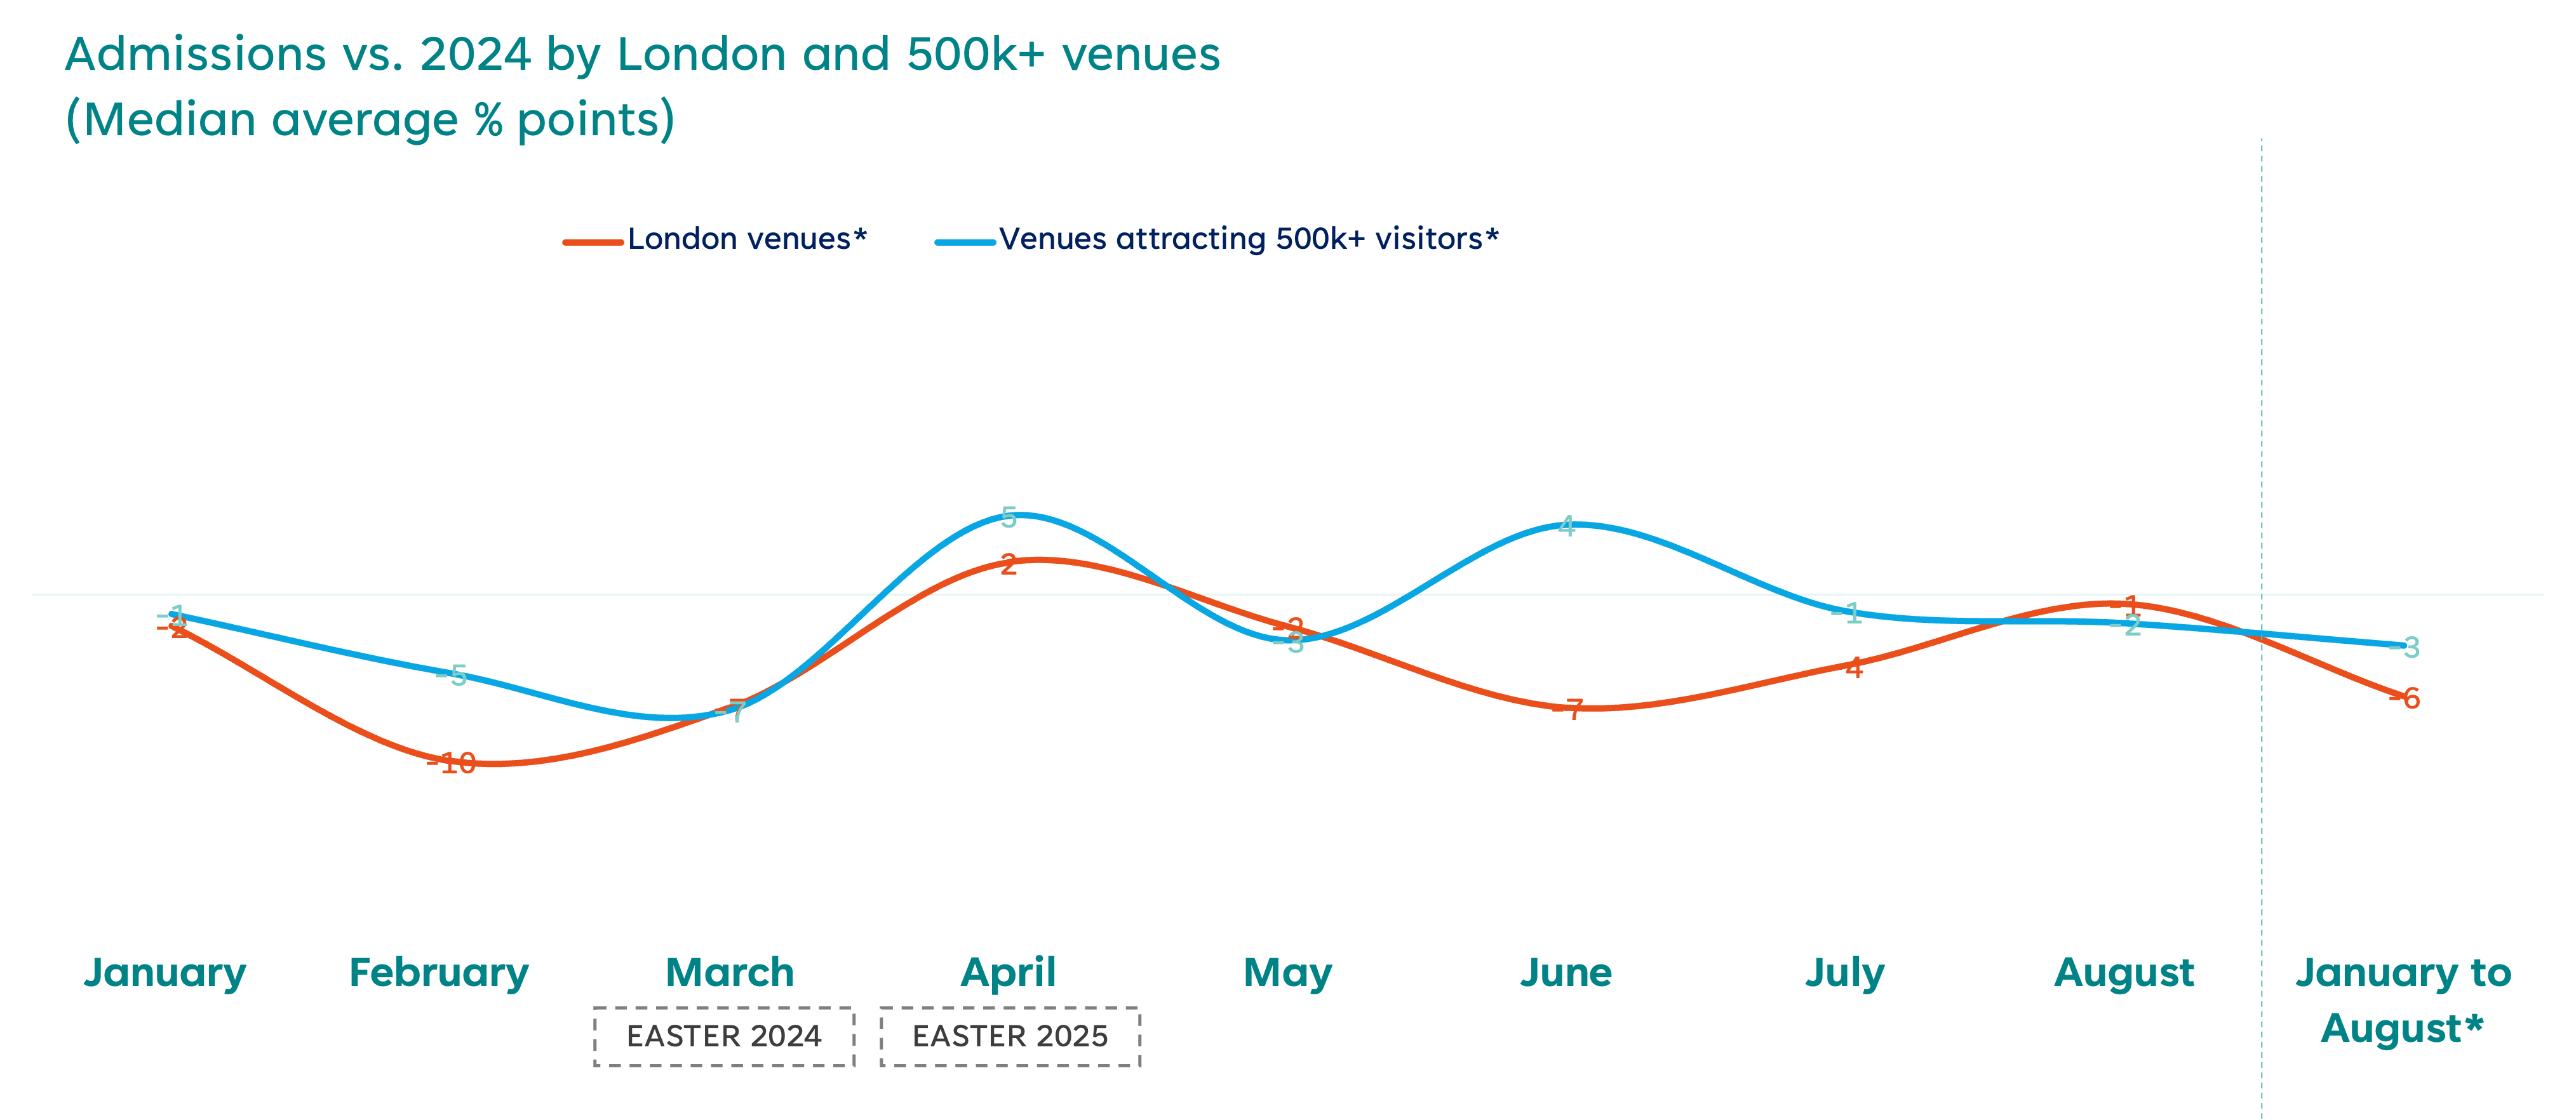
- London, charging sites and large venues further down than average
- Retail performing less well than catering
- Weather, programming and cost-of-living are key drivers of performance relative to 2024.
In these challenging times, it is encouraging that year-to-date admissions are only 1% down on 2024, with 39% of venues reporting an increase in visits. This highlights the sector’s resilience at a time when cost-of-living fears and savings ratios (a sign of spending caution) are higher than a year earlier.
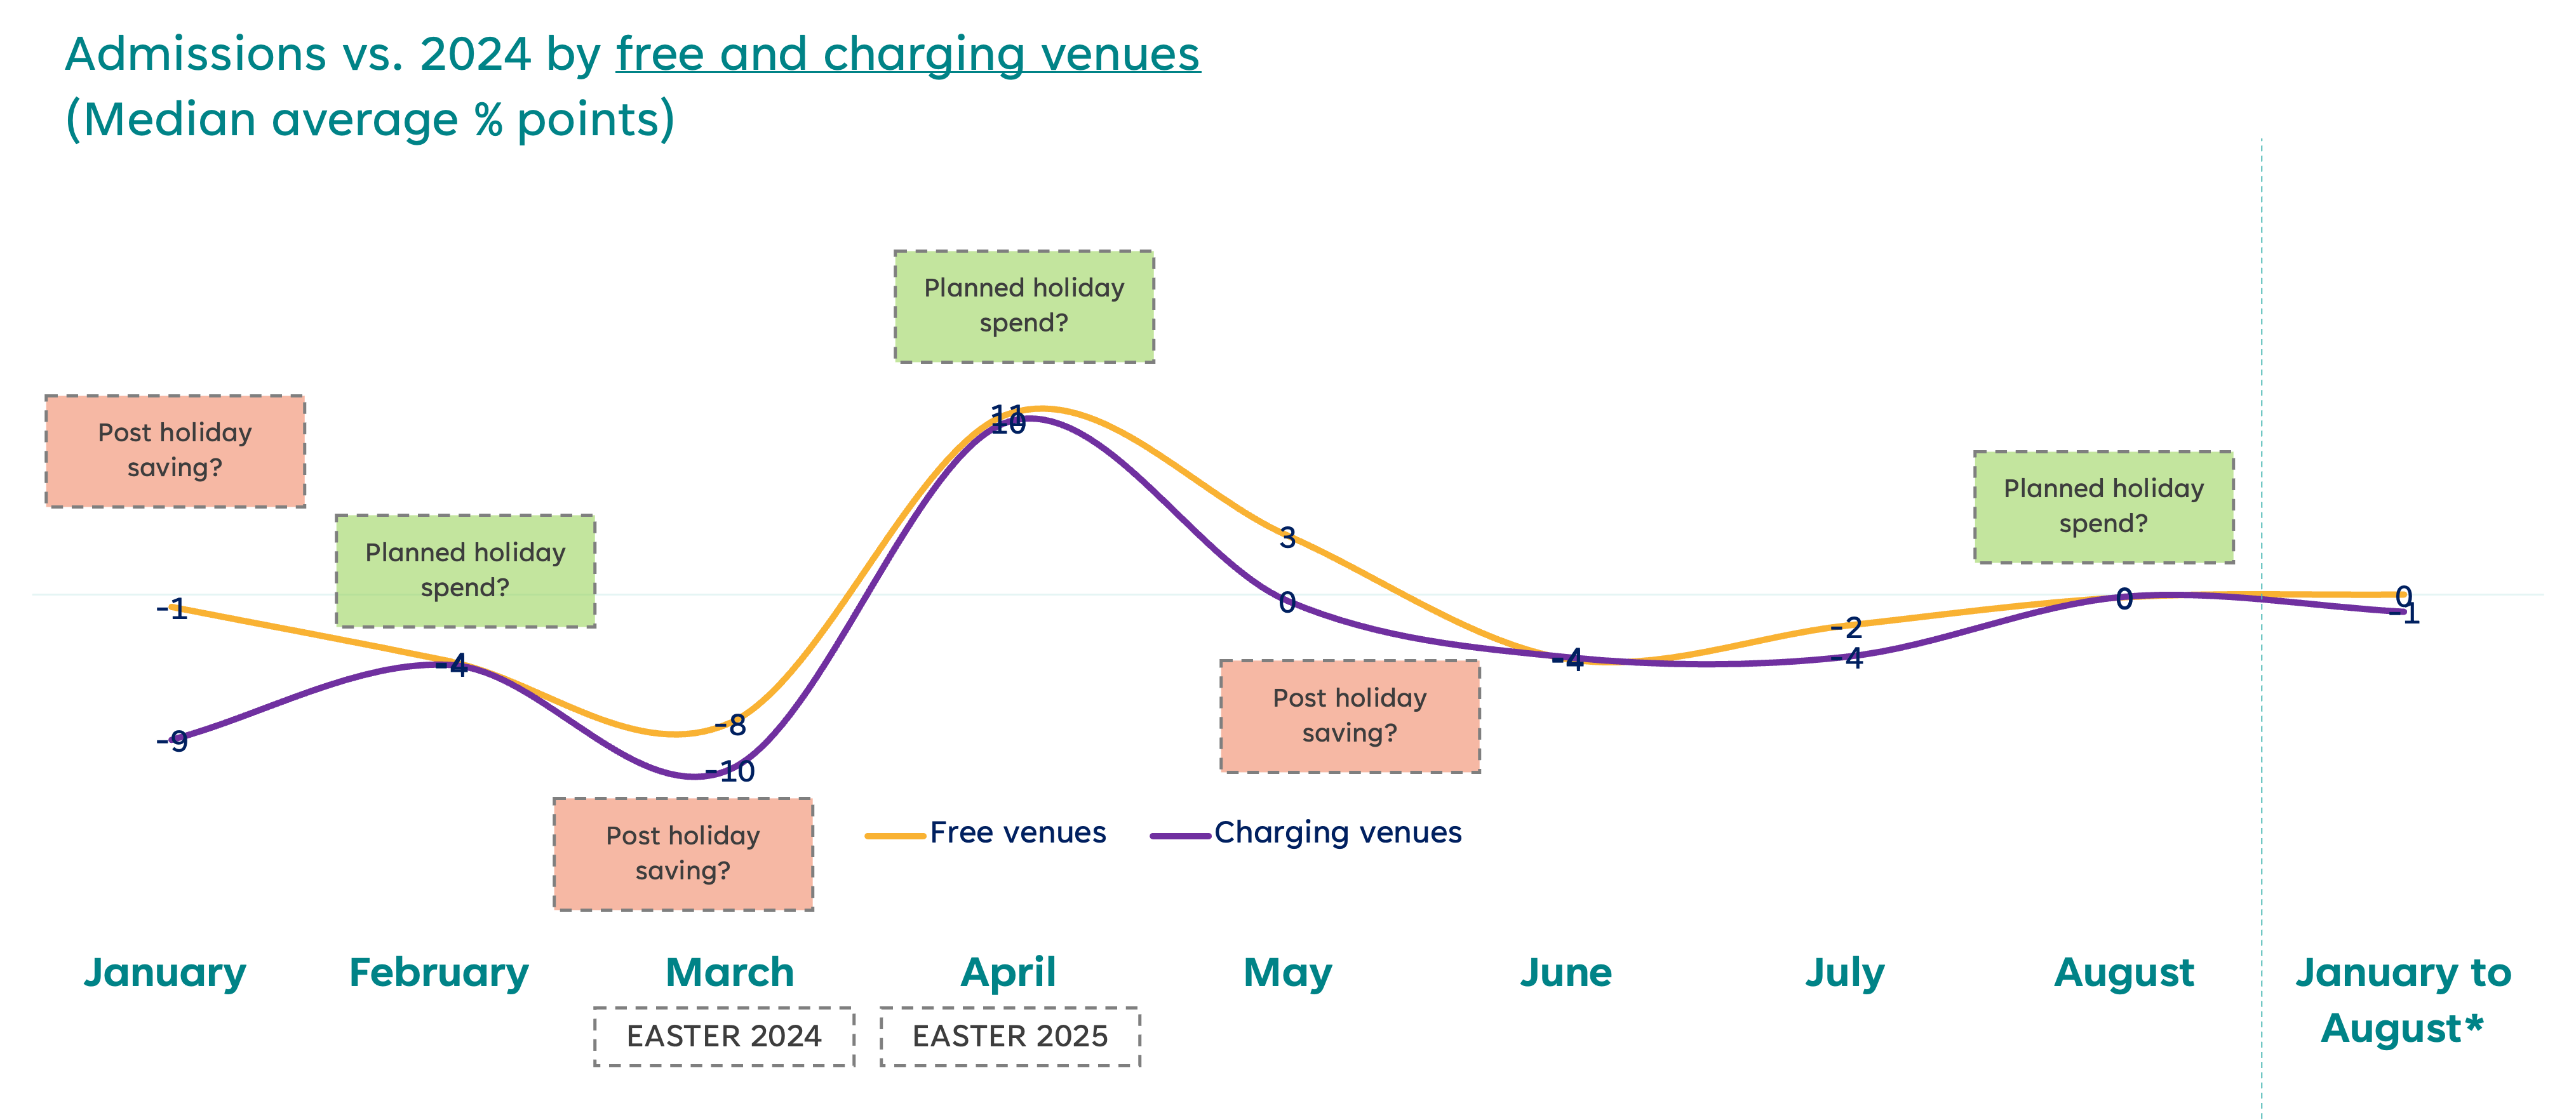
However, there are definitely signs that financial fears are impacting spend. One example of this is admissions reporting from ‘charging venues’, which are 2% down on 2024, compared to 0% for free venues. What’s particularly notable amongst the charging cohort is that the main drop-offs occur in the months immediately after school holidays, suggesting that families may be spending as normal during the school break but cutting back after.
We may also be seeing signs of cutbacks in retail spend, with both ATV and SPV tracking below inflation for almost every month this year. With catering faring slightly better, this may be another sign of the public reducing ‘non-essential’ spending without sacrificing their experiences altogether.
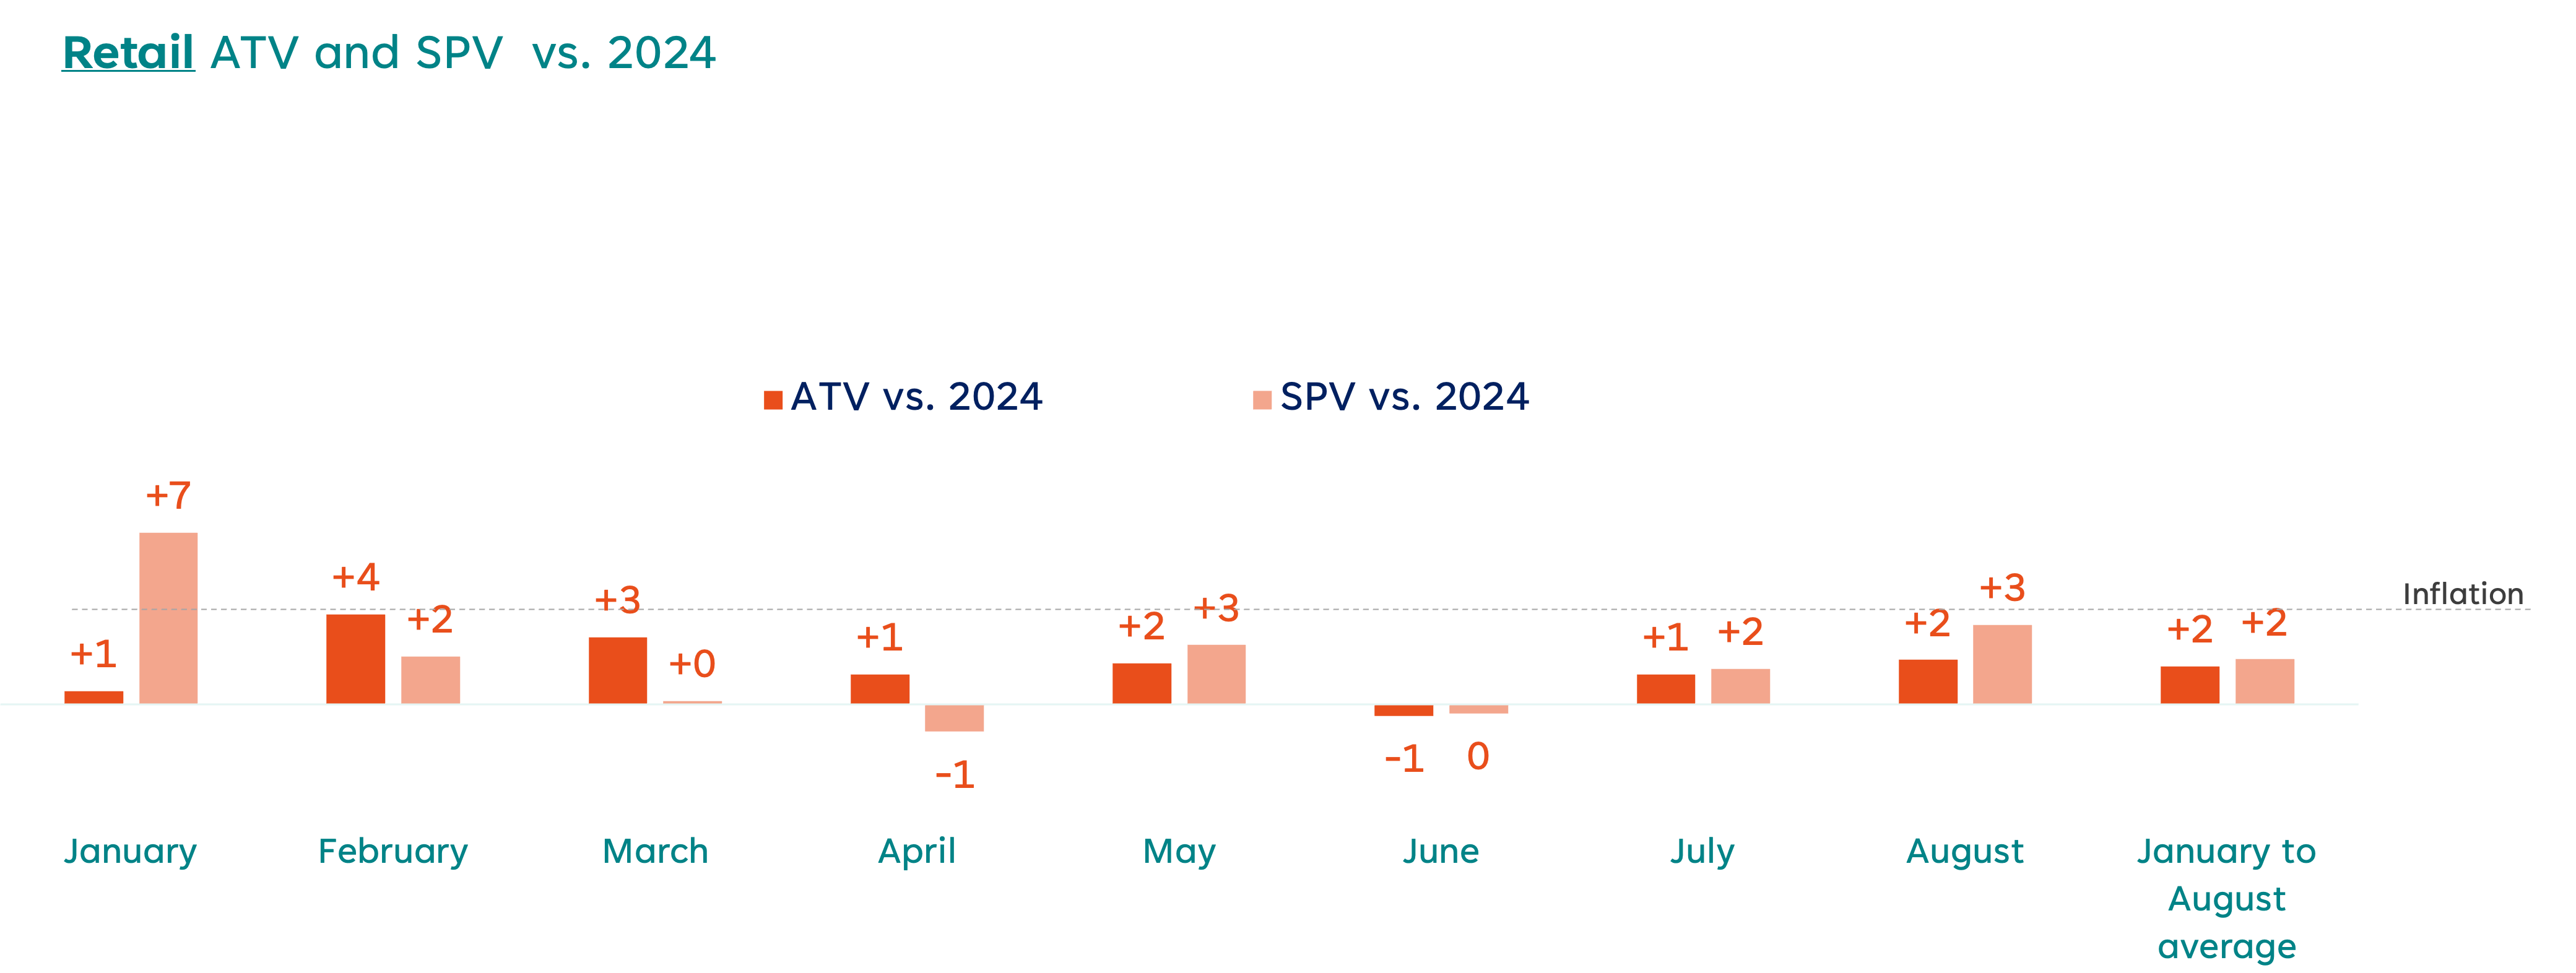
The below-inflation increase in retail spend could also be linked to product pricing strategies – over half of venues not matching inflationary price rises with their product pricing, compared to just a third in catering. That said, the picture here is a little more nuanced – retail ATV and SPV is more likely to increase when prices are kept lower, and many venues have benefitted from selective price increases (e.g. to best-sellers).
Our special question on guidebook conversion also highlighted the power of active upselling – Imperial War Museums is the most impressive example of this (6% at their free sites, and 11% at charging venues).
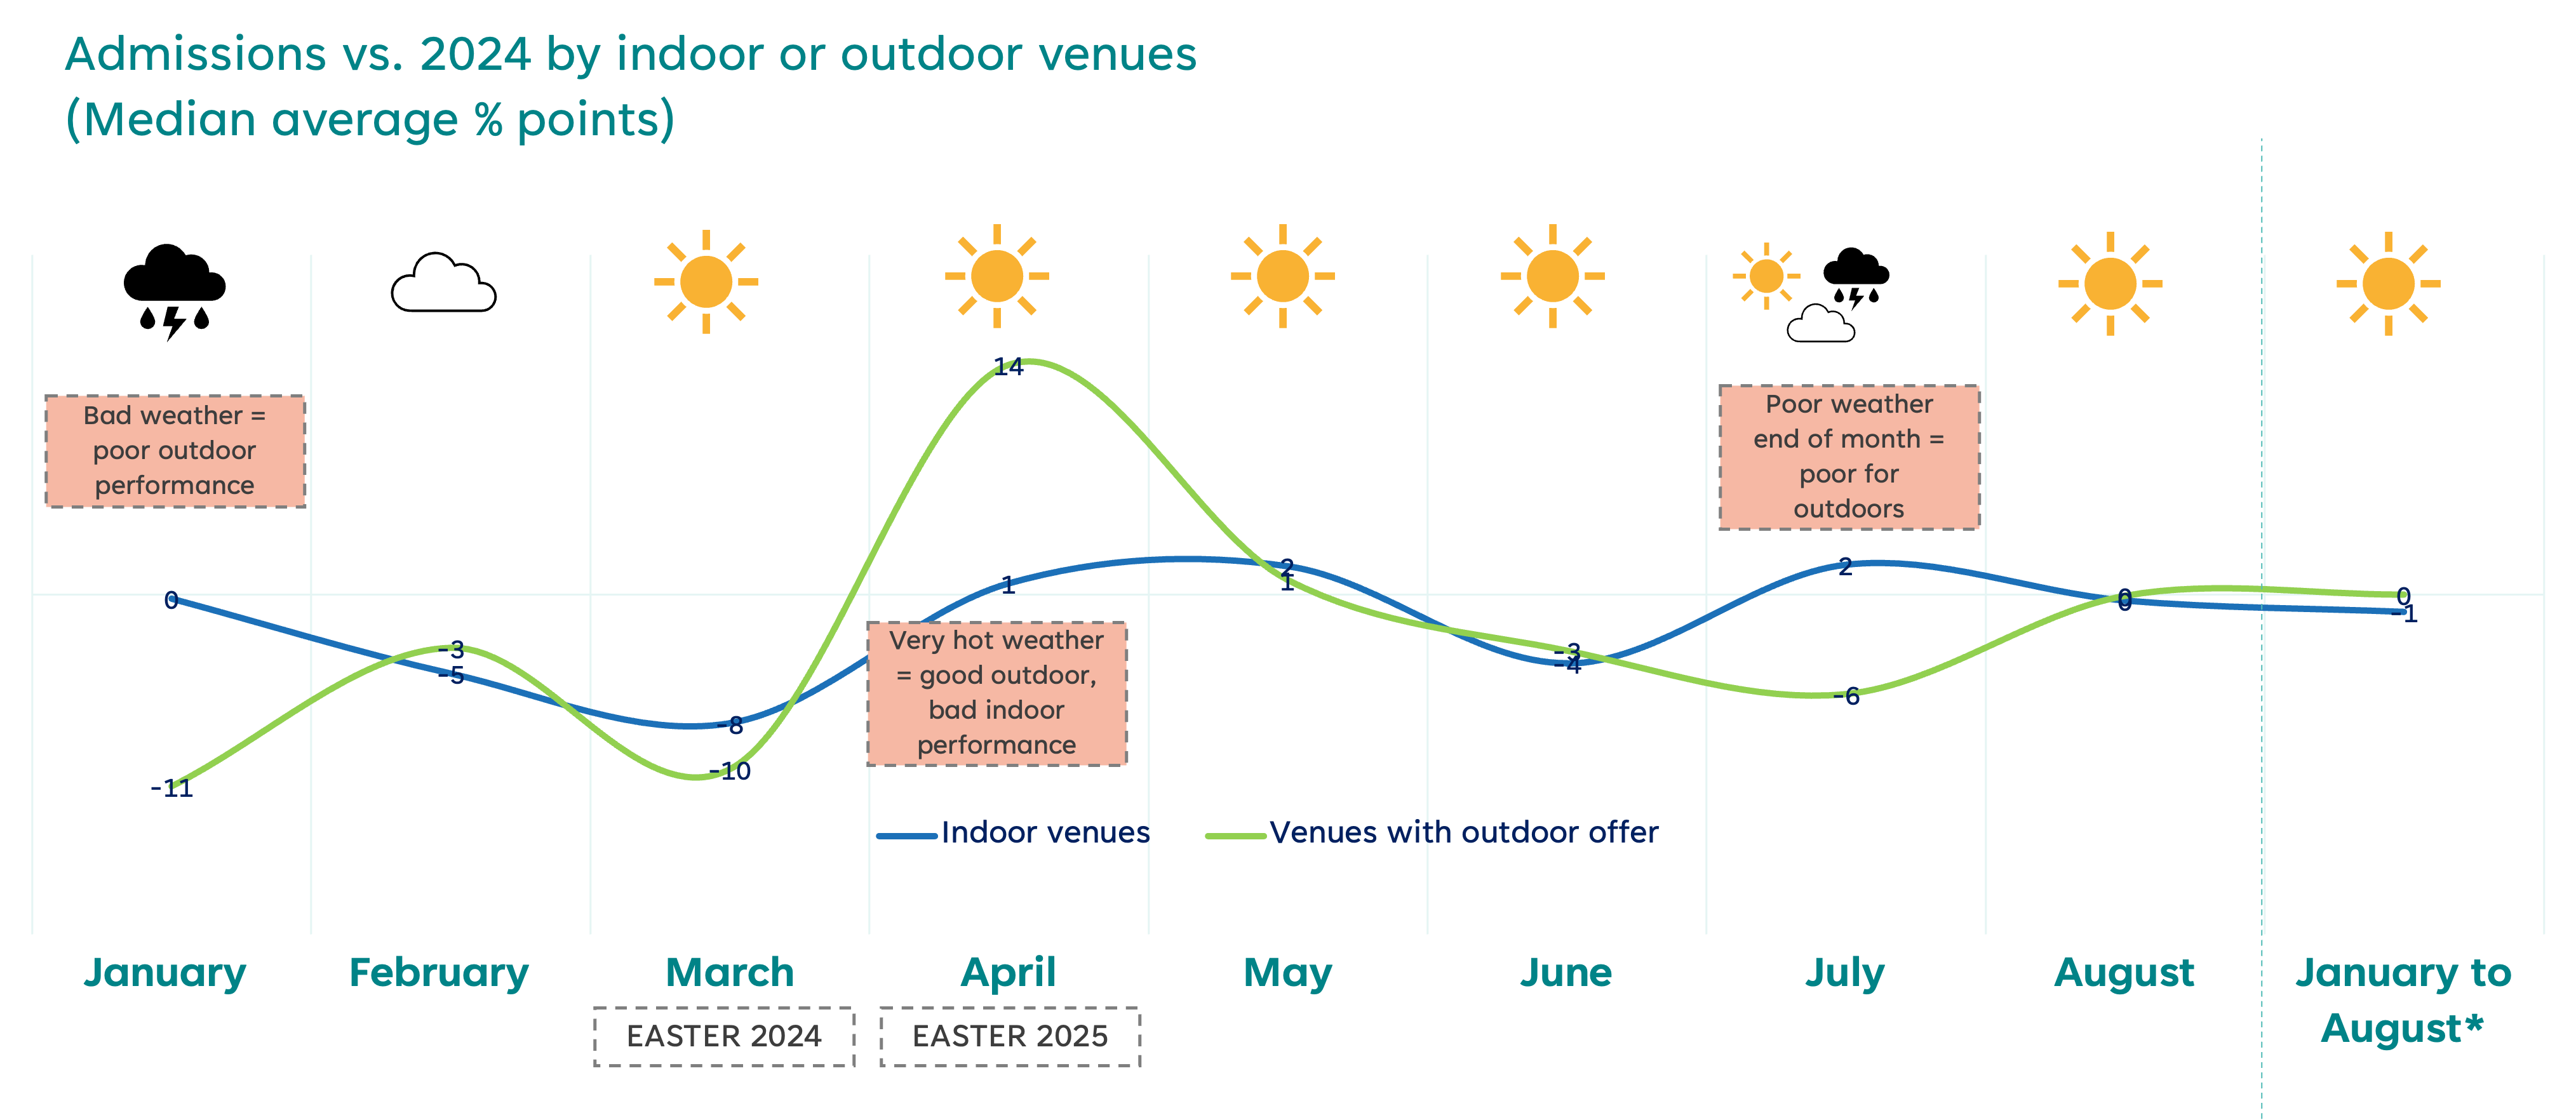
Any assessment of 2025 should consider weather. By my reading (via the Met Office), we have experienced extreme storms or extreme heat in six out of eight month so far this year. This has led to indoor and outdoor venues experiencing a potluck of fortunes relative to a year earlier, and venues citing it as the main driver of performance in almost every month.
Venues in London and other tourist hotspots are susceptible to all of the above, but also have to grapple with a decline in domestic holidays (and potentially overseas visits) this year. So it’s no surprise that they are tracking well below average as of the end of August.
More positively, August once again demonstrated the brilliant impact programming can have on revenue – 32% citing it as the main driver of commercial performance. In the webinar we highlighted innovative programming that positively drove admissions and secondary spend. Examples included:
- BALTIC Centre for Contemporary Art’s ‘Road to Wembley’ exhibition
- Old Royal Naval College’s ‘Labyrinth On The Thames’ music festival
- Ashmolean Museum’s ‘This is What You Get’ exhibition
- The Cartoon Museum’s ‘Cats in Cartoons’ exhibition (a personal favourite!)
With the bulk of the year now behind us, there are limited chances to turn fortunes around, but our findings suggest a few tactics including:
- Ensuring programming has strong commercial appeal
- Considering pricing or ticket strategies that counteract the post-holiday dip
- Testing retail pricing to see what actually drives increases in revenue – perhaps your bestsellers have more elasticity than you think
- Supporting staff with upselling, particularly with guidebooks at the start of the visit.
Where to find out more
Members can learn much more via the Commercial Performance Barometer online dashboard where you can search by sub-group and merge months.
You can also watch the recording of our recent webinar, where we delve into more detail around key findings and share examples of best practice across the sector.
The Association has now had more than 260 sites contribute to the Barometer and is looking forward to continuing to grow this service in the coming months.
For more information about the Commercial Performance Barometer please contact tom@culturalenterprises.org.uk or jon.young@decisionhouse.co.uk.